Quantcast
Channel: News – DroneMapper
Viewing all articles
Browse latest Browse all 100

Data Science Basic Crop Analysis with UAV Imagery and Micasense Altum

$
0
0

https://github.com/dronemapper-io/CropAnalysis

A jupyter notebook with crop analysis algorithms utilizing digital elevation models, dtm and multi-spectral imagery (R-G-B-NIR-Rededge-Thermal) from a MicaSense Altum sensor processed with DroneMapper Remote Expert.

Due to limitations on git file sizes, you will need to download the GeoTIFF data for this project from the following url: https://dronemapper.com/software/DroneMapper_CropAnalysis_Data.zip. Once that has been completed, extract the TIF files into the notebook data directory matching the structure below.

Included Data

  • data/DrnMppr-DEM-AOI.tif – 32bit georeferenced digital elevation model
  • data/DrnMppr-ORT-AOI.tif – 16bit georeferenced orthomosaic (Red-Green-Blue-NIR-Rededge-Thermal)
  • data/DrnMppr-DTM-AOI.tif – 32bit georeferenced dtm
  • data/plant_count.shp – plant count AOI
  • data/plots_1.shp – plot 1 AOI
  • data/plots_2.shp – plot 2 AOI
  • output/*.csv – output csv of dataframes

Algorithms

  • plot volume/biomass
  • plot canopy height
  • plot ndvi zonal statistics
  • plot thermals
  • plant count

Notes

These basic algorithms are intended to get you started and interested in multi-spectral processing and analysis.

The orthomosaic, digital elevation model, and dtm were clipped to an AOI using GlobalMapper. The shapefile plots were also generated using GlobalMapper grid tool. We highly recommend GlobalMapper for GIS work!

We cloned the MicaSense imageprocessing repository and created the Batch Processing DroneMapper.ipynb notebook which allows you to quickly align and stack a Altum or RedEdge dataset creating the correct TIF files with EXIF/GPS metadata preserved. These stacked TIF files are then directly loaded into DroneMapper Remote Expert for processing.

This notebook assumes the user has basic knowledge of setting up their python environment, importing libraries and working inside jupyter.

Do More!

Implement additional algorithms like NDRE or alternative methods for plant counts. Submit a pull request to the repo!

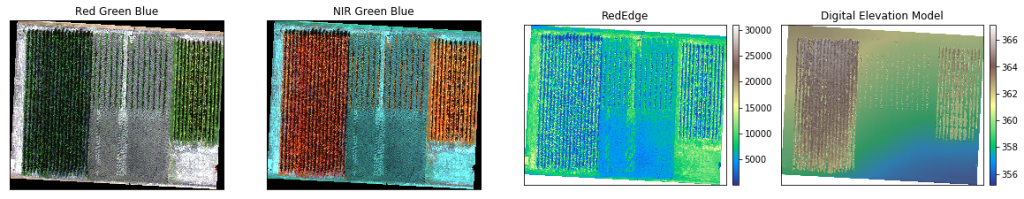
Load Digital Elevation Model and Orthomosaic

Orthomosaic-DigitalElevationModel

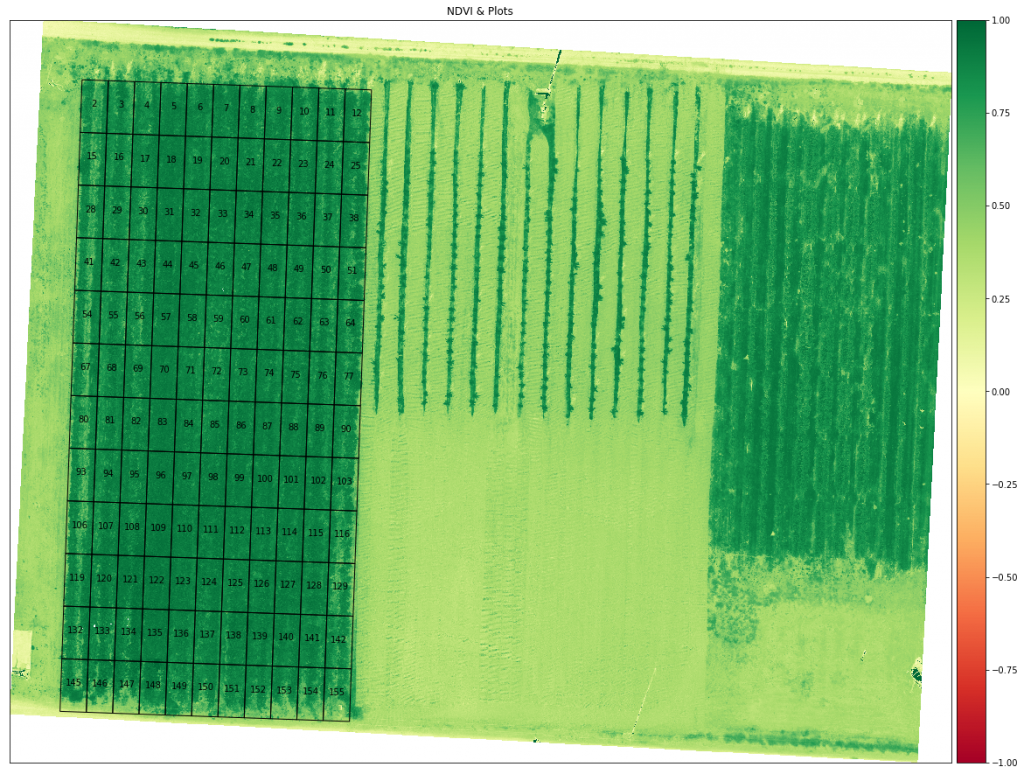
Load Plot 1 AOI and Generate NDVI

ndvi_zonal_statistics

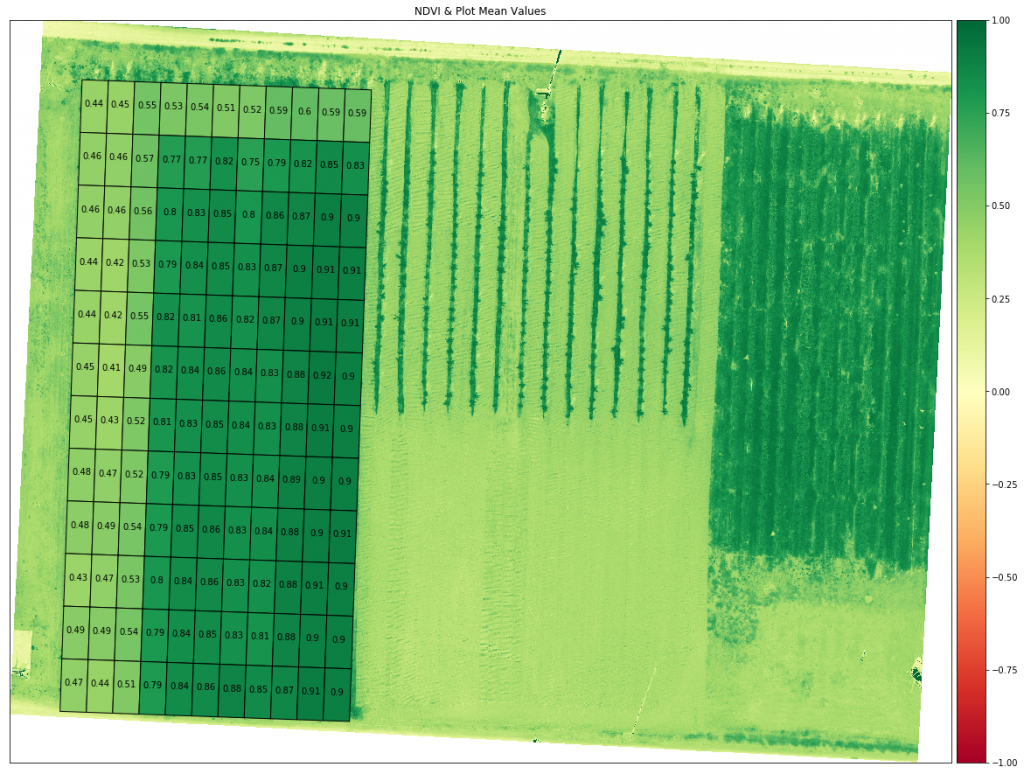
Generate NDVI Zonal Statistics For Each Plot

 ndvi_zonal_statistics_plots
geometry LAYER MAP_NAME NAME min max mean count std median
0 POLYGON Z ((289583.708 5130289.226 0.000, 2895… Coverage/Quad User Created Features 2 0.188461 0.873092 0.438559 4444 0.078921 0.436500
1 POLYGON Z ((289588.705 5130289.052 0.000, 2895… Coverage/Quad User Created Features 3 0.193214 0.887971 0.445282 4440 0.091090 0.425304
2 POLYGON Z ((289593.702 5130288.877 0.000, 2895… Coverage/Quad User Created Features 4 0.232222 0.890147 0.552864 4440 0.112440 0.519746
3 POLYGON Z ((289598.699 5130288.703 0.000, 2896… Coverage/Quad User Created Features 5 0.090825 0.865083 0.530295 4444 0.110570 0.515392
4 POLYGON Z ((289603.696 5130288.528 0.000, 2896… Coverage/Quad User Created Features 6 0.104697 0.922450 0.536660 4442 0.132731 0.495813

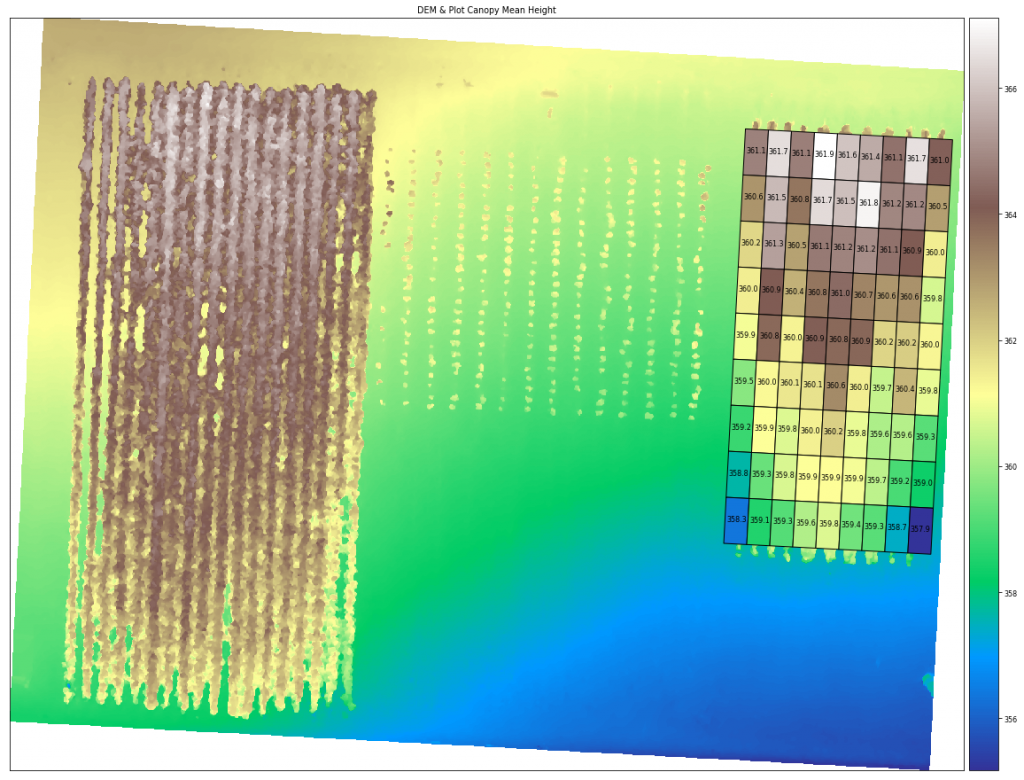
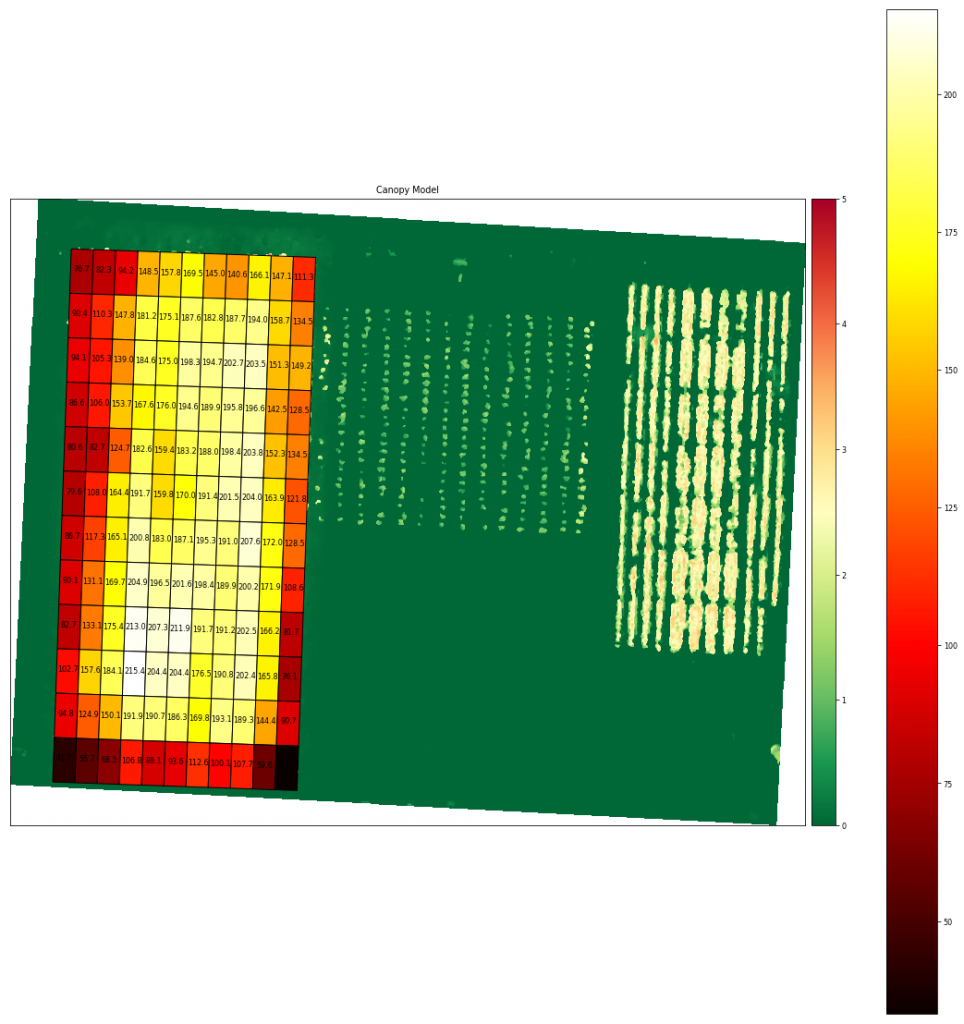
Load Plot 2 AOI & Compute DEM Canopy Mean Height For Each Plot

 canopy_height_dem
geometry LAYER MAP_NAME NAME min max mean count std median
0 POLYGON Z ((289707.875 5130279.812 1182.502, 2… Coverage/Quad User Created Features – Coverage/Quad 1 360.129120 363.381683 361.141294 3318 1.091593 360.441467
1 POLYGON Z ((289712.189 5130279.586 1190.569, 2… Coverage/Quad User Created Features – Coverage/Quad 2 360.131866 363.382446 361.710297 3316 1.215926 361.927017
2 POLYGON Z ((289716.503 5130279.360 1183.212, 2… Coverage/Quad User Created Features – Coverage/Quad 3 360.117279 363.384766 361.138592 3310 1.122890 360.425781
3 POLYGON Z ((289720.817 5130279.134 1182.668, 2… Coverage/Quad User Created Features – Coverage/Quad 4 360.110443 363.387207 361.915436 3322 1.258644 362.585251
4 POLYGON Z ((289725.131 5130278.908 1182.782, 2… Coverage/Quad User Created Features – Coverage/Quad 5 360.006683 363.377991 361.558501 3320 1.305164 360.546524

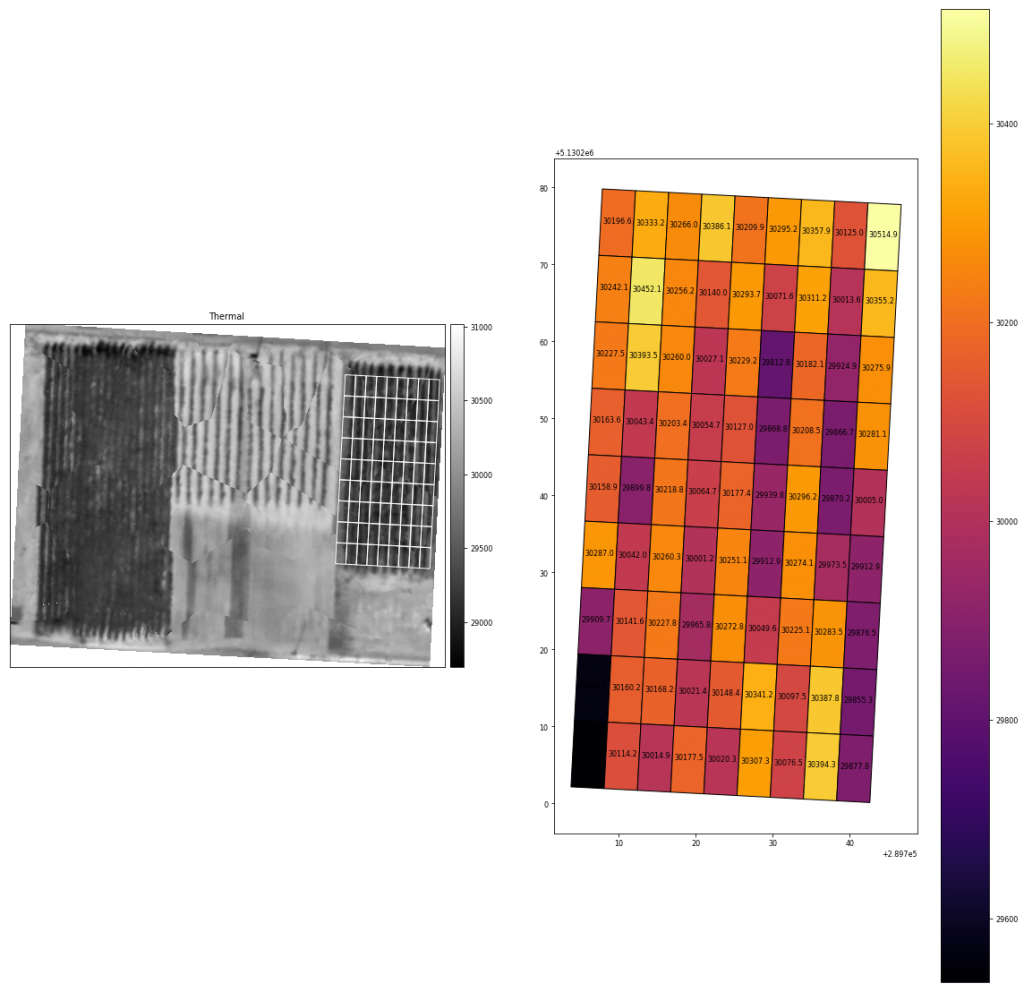
Compute Thermal Mean For Each Plot

The thermal band (5) in the processed orthomosaic shows stitching artifacts which could likely be improved using more accurate pre-processing alignment and de-distortion algorithms. You can find more information about these functions in the MicaSense imageprocessing github repository. See notes at the top of this notebook.

 
geometry LAYER MAP_NAME NAME min max mean count std median
0 POLYGON Z ((289707.875 5130279.812 1182.502, 2… Coverage/Quad User Created Features – Coverage/Quad 1 30008.0 30431.0 30196.628692 3318 120.982058 30193.0
1 POLYGON Z ((289712.189 5130279.586 1190.569, 2… Coverage/Quad User Created Features – Coverage/Quad 2 30068.0 30560.0 30333.192702 3316 123.856093 30332.0
2 POLYGON Z ((289716.503 5130279.360 1183.212, 2… Coverage/Quad User Created Features – Coverage/Quad 3 29792.0 30645.0 30266.030211 3310 170.831207 30275.5
3 POLYGON Z ((289720.817 5130279.134 1182.668, 2… Coverage/Quad User Created Features – Coverage/Quad 4 29790.0 30700.0 30386.137267 3322 201.266919 30391.0
4 POLYGON Z ((289725.131 5130278.908 1182.782, 2… Coverage/Quad User Created Features – Coverage/Quad 5 29618.0 30691.0 30209.904518 3320 292.299392 30262.0

Load Plot 1 AOI & Compute Volume/Biomass For Each Plot

biomass
geometry LAYER MAP_NAME NAME min max mean count sum volume_m3 area_m2
0 POLYGON Z ((289583.708 5130289.226 0.000, 2895… Coverage/Quad User Created Features 2 -0.153473 3.525543 1.532524 4444 6810.538483 76.650368 50.0
1 POLYGON Z ((289588.705 5130289.052 0.000, 2895… Coverage/Quad User Created Features 3 -0.094482 3.575226 1.646664 4440 7311.188690 82.285021 50.0
2 POLYGON Z ((289593.702 5130288.877 0.000, 2895… Coverage/Quad User Created Features 4 -0.070648 3.992493 1.884596 4440 8367.608276 94.174676 50.0
3 POLYGON Z ((289598.699 5130288.703 0.000, 2896… Coverage/Quad User Created Features 5 0.032928 4.575989 2.969443 4444 13196.202637 148.518915 50.0
4 POLYGON Z ((289603.696 5130288.528 0.000, 2896… Coverage/Quad User Created Features 6 0.074188 5.105408 3.155879 4442 14018.412506 157.772617 50.0

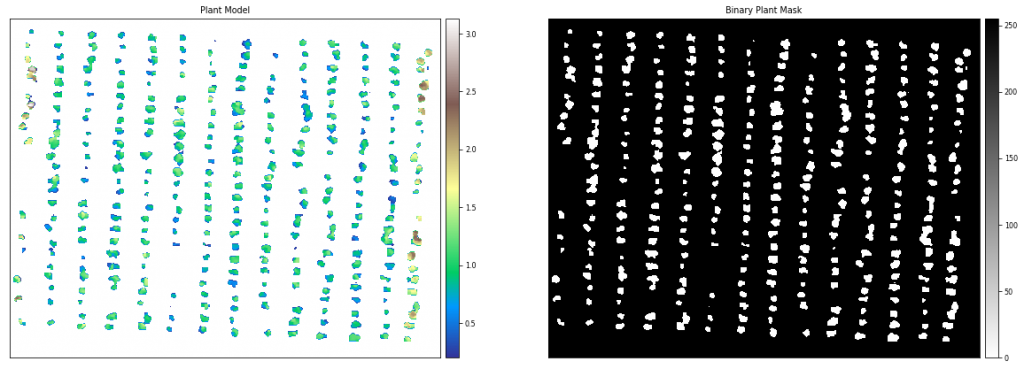
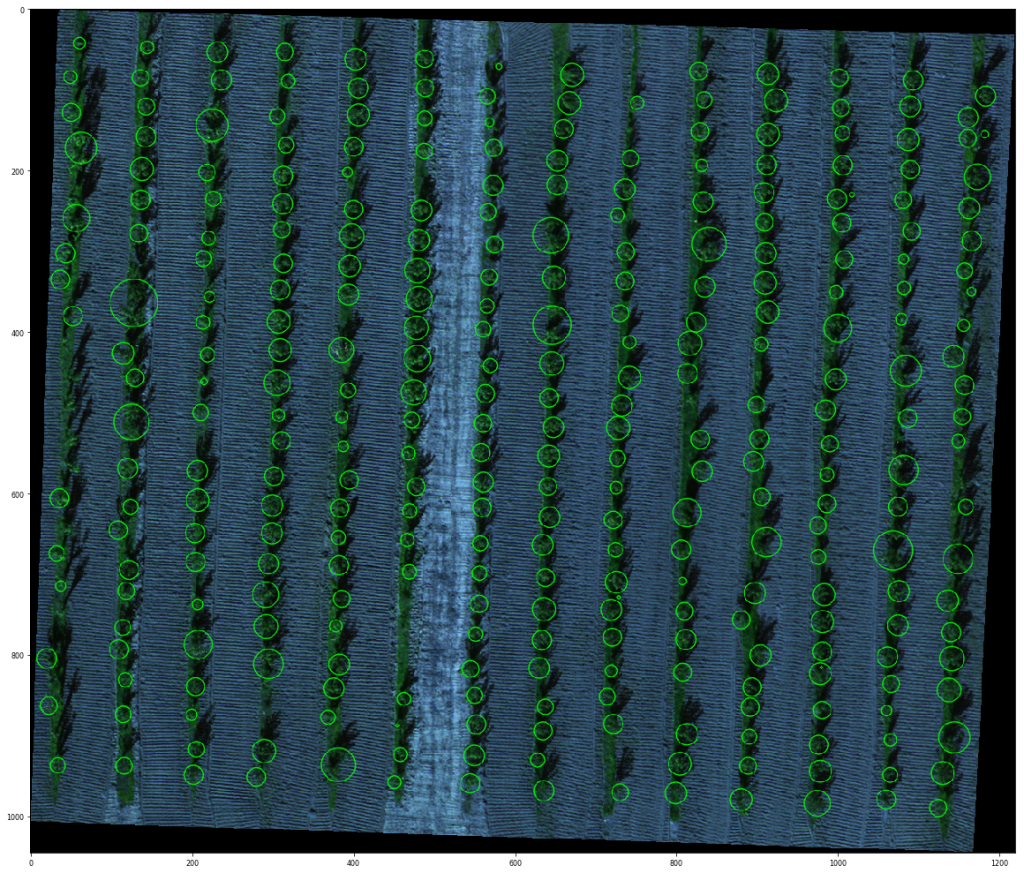
Load Plant Count AOI & Count Plants

plant_count
plant_count
Plant count: 310
UTMX UTMY
0 289622.411171 5130240.899705
1 289621.849705 5130244.325966
2 289622.101569 5130248.858655
3 289621.865086 5130253.863387
4 289621.436280 5130258.158493

Thanks! Keep an eye out for future notebooks and algorithms.

The post Data Science Basic Crop Analysis with UAV Imagery and Micasense Altum appeared first on DroneMapper.


Viewing all articles
Browse latest Browse all 100

Trending Articles